What Are Echo Tops?
Here’s what you need to know about echo tops, including how they’re determined and how they compare to cloud tops.
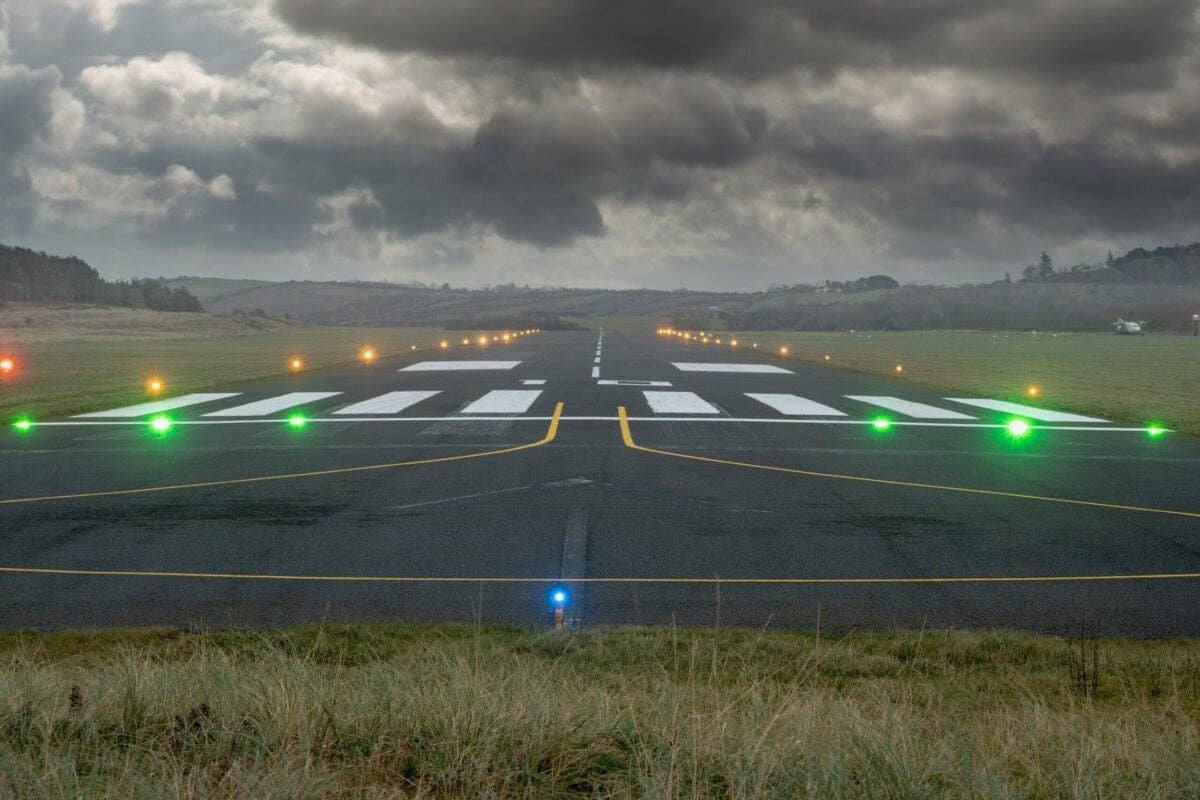
Despite what many pilots are taught, echo tops do not represent the height of the cloud tops. [Credit: Shutterstock]
Question: Are echo tops the same as cloud tops?
Answer: The short answer is no. Echo top height is a volume product that originates from the NWS WSR-88D NEXRAD Doppler radars.
This is the same network of radars that is used to build the familiar radar mosaic pilots readily use in the cockpit. While not provided in the FIS-B broadcast, the echo top height product, however, is arguably the most misused data that is broadcast by SiriusXM to your satellite-based weather receiver.
Despite what many pilots are taught, this product does not represent the height of the cloud tops and should never be used as such since it is often likely to produce unreliable and inconsistent results.
When looking at any ground-based radar depiction, the colors you see are mapped to a quantity in decibels of Z, often abbreviated dBZ, where Z is the reflectivity parameter. As the name implies, reflectivity is the amount of energy that is returned (reflected) back to the receiver after hitting a target.
For precipitation, these targets are called hydrometeors that include rain, snow, ice pellets, and hail. There are a few exceptions, but generally speaking, the higher the dBZ value, the heavier the precipitation.
All deep, moist convection or thunderstorms have both a cloud top (the highest point of the cloud as measured from sea level) and top of the precipitation core within the convection. The “top” of the precipitation core is defined as the msl height of the highest radar reflectivity of 18 dBZ. This altitude is referred to as the echo top height.

For example, imagine taking a vertical “slice” through a typical thunderstorm, such as the one shown above. The white dashed line shows the west-to-east slice with the echo top height shown on the left and the base reflectivity from the lowest elevation angle shown on the right. The radar depiction on the right is the view most familiar to a pilot.
However, to better illustrate how the echo tops are determined, the depiction below is this same slice from above that is shown as a vertical cross section of the radar reflectivity. In other words, it depicts all possible elevation angles from the radar’s volume scan through this slice.

The colors are the reflectivity values in dBZ. The highest values shown in the precipitation core are about 55-60 dBZ and are all below about 7 kilometers (about 23,000 feet). As height increases in the core, notice the values drop off to less than 15 dBZ.
By connecting the points where the values in the core drop off to the 18 dBZ value, this represents the echo top height (shown by the white squiggly line). For this cell, the highest point in this cross-section is 17 kilometers or roughly 56,000 feet msl.
Cloud top height, on the other hand, is higher than the echo top height. In fact, it can be 5,000 to 10,000 feet higher in some of the most intense storms.
The visible satellite image below is a good example of thunderstorms with overshooting tops. Given the time of day, the highest tops actually cast a shadow on the thunderstorm anvil. This is the column of air in the thunderstorm that will usually have the highest echo tops due to the vigorous updraft.

Echo top heights are specifically used by forecasters to identify the most significant storms by locating the highest echo regions. Stronger updrafts are seen in regions where the highest echo tops are located.
Moreover, the parameter that has the highest apparent correlation with lightning is not the highest cloud top but rather the highest detected radar echo top of 30 dBZ or greater.

Shown above is the SiriusXM composite radar mosaic shown with the Garmin Pilot app. In addition to the radar reflectivity, storm cell identification tracking (SCIT) markers are shown.
These attempt to identify the movement and echo top height of various cells in the radar mosaic. The height provided is measured in hundreds of feet. If there’s an arrow, this defines the direction of movement, and the end of the arrow represents where the cell might be located in the next 60 minutes given its current speed and direction of movement.
Lastly, this may seem obvious, but echo tops are not going to help identify the vertical extent of many weather systems unless those clouds are producing some kind of precipitation in the form of rain, snow, hail, or ice pellets.
Therefore, a stratus deck, even one that has some depth, won’t likely be picked up by the radar. In fact, it’s not likely you will see echo tops shown below 20,000 feet because of this. Echo tops are more appropriate for convective precipitation where the clouds have significant vertical depth.


Sign-up for newsletters & special offers!
Get the latest FLYING stories & special offers delivered directly to your inbox